PDPM Reimbursement Model Financial Impact

PDPM changed how skilled nursing facilities get paid, shifting the money away from therapy minutes and toward how sick a patient looks on paper. That switch, effective October 1, 2019, rewired the financial engine of the whole SNF sector. Five years out, the data shows both the upside it opened up and the scrutiny it invited, and pulling those two things apart turns out to be harder than most operators expected going in.
Before getting into where the money moved, it helps to be precise about what PDPM actually did. It replaced RUG-IV, a model that paid facilities largely based on minutes of physical, occupational, and speech therapy delivered. PDPM instead builds payment around six per-diem components: five are case-mix adjusted (PT, OT, SLP, Nursing, and Non-Therapy Ancillaries), and one is not. Interim Payment Assessments let a facility reclassify a patient mid-stay if their condition changes in a real, documented way, so payment isn't frozen at admission. The lever that moved money stopped being the therapy schedule and became the clinical chart.
Why the budget-neutrality assumption collapsed almost immediately
CMS built PDPM to cost the same as RUG-IV overall. That promise didn't hold for long. Early CMS analysis found the new model generated an unintended payment increase of roughly 5%, about $1.7 billion a year, even though the whole point of the redesign was to leave total spending flat. CMS's read on why was blunt: this wasn't sicker patients showing up at SNFs. It was coding behavior.
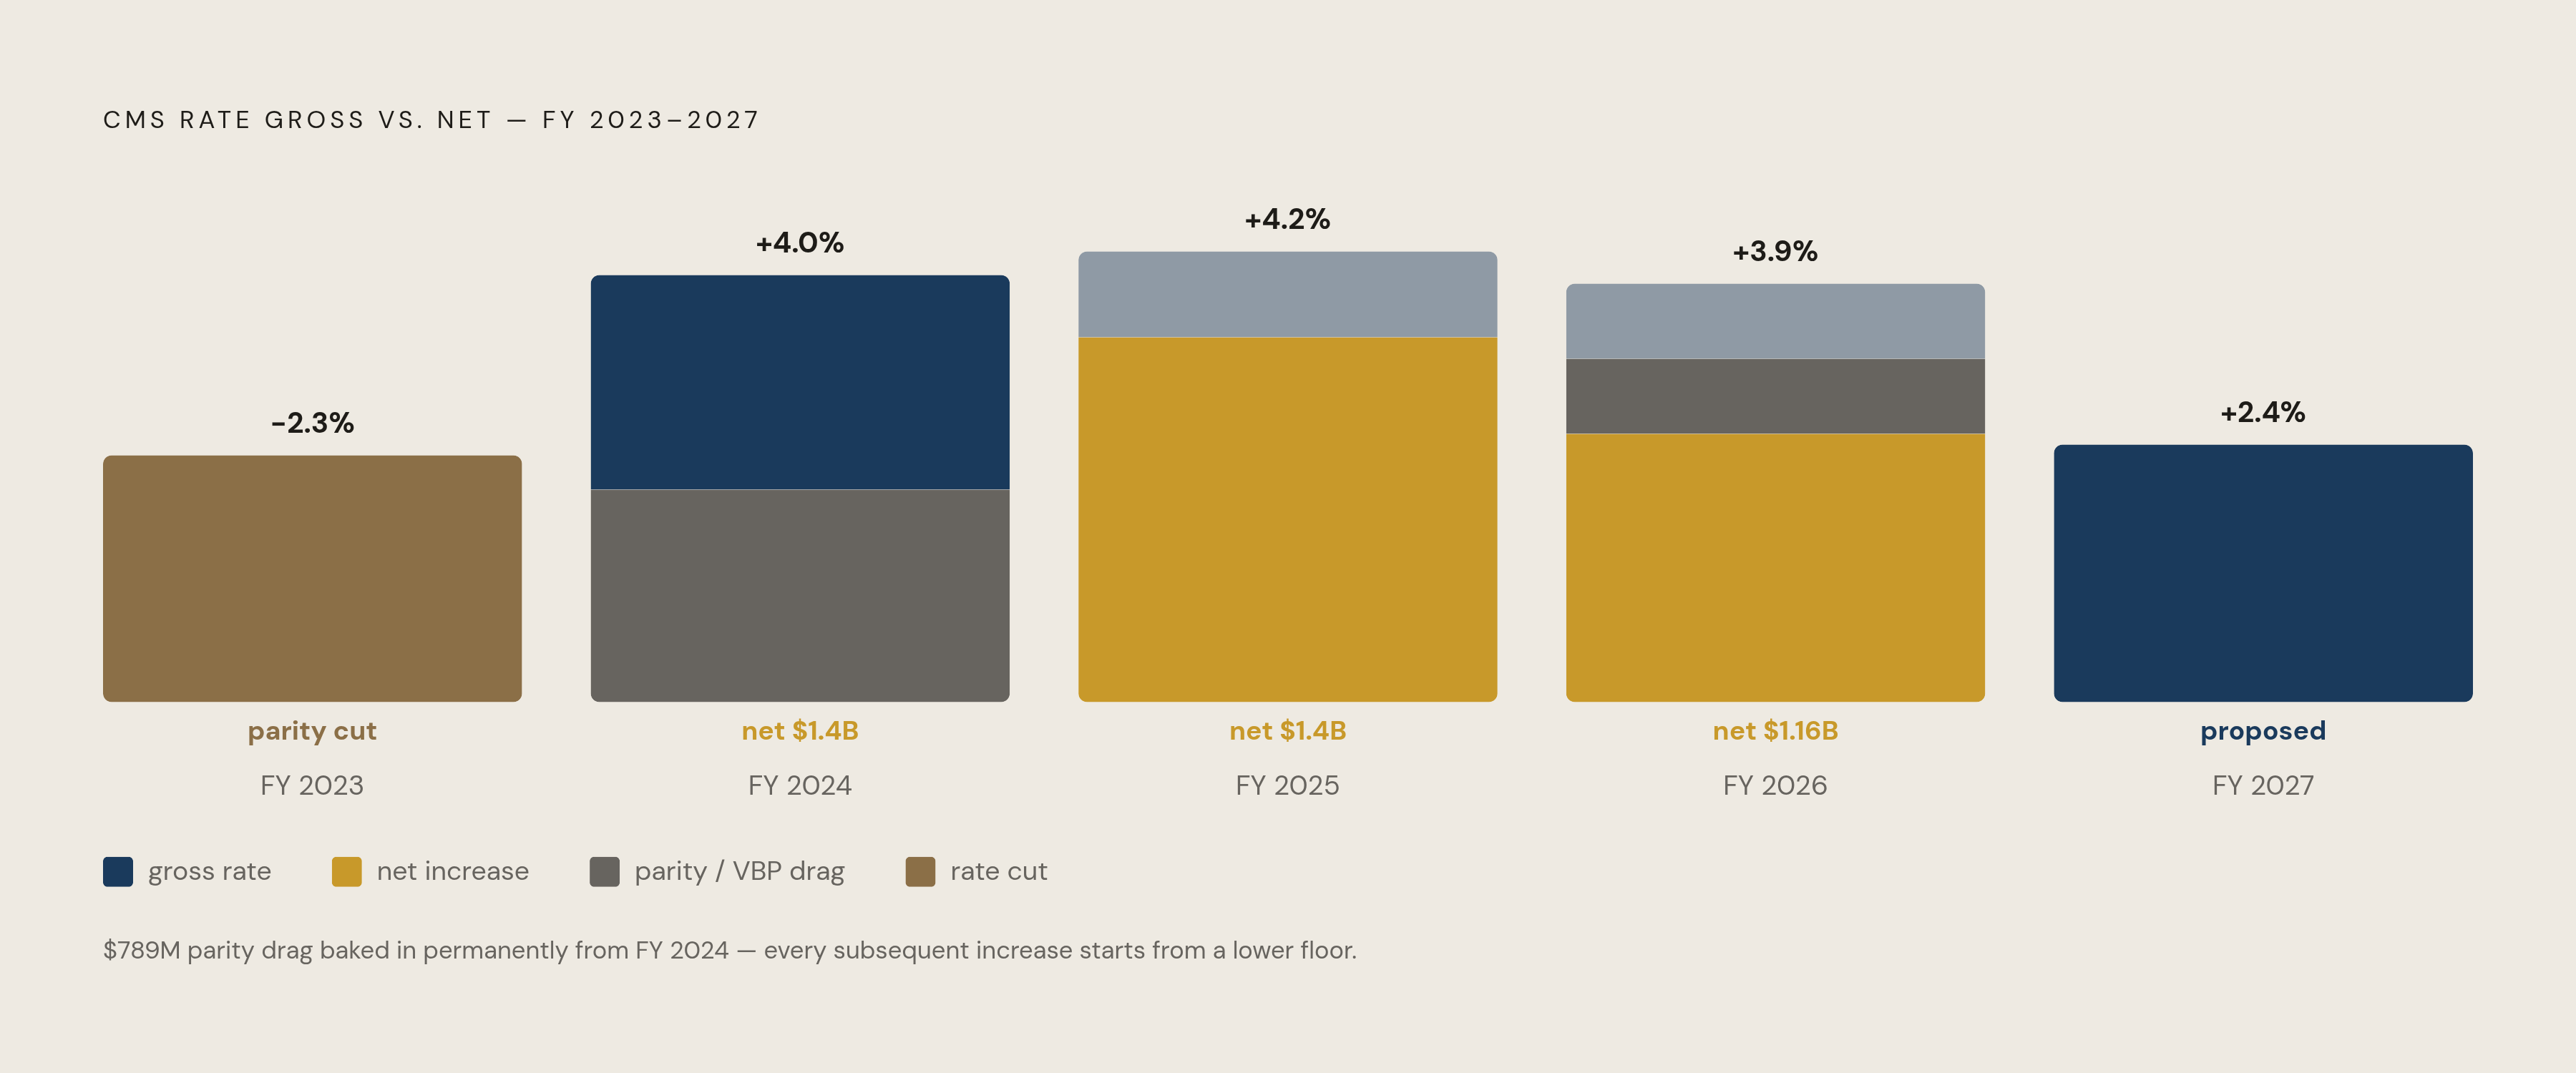
The agency's response landed in the FY 2023 final rule: a 4.6% PDPM parity adjustment, split into a 2.3% cut in FY 2023 and another 2.3% cut in FY 2024. The second cut got partly offset by a $2.2 billion market basket increase, which is why FY 2024 still came out as a net 4.0% gain, around $1.4 billion. But the underlying parity clawback, a $789 million drag, is baked into the rate calculation permanently now. Nobody's treating it as a one-year correction anymore.
Follow the rate trajectory since then and a pattern emerges. FY 2025 delivered a net 4.2% increase (about $1.4 billion), built from a 3.0% market basket update plus a 1.7% forecast error correction, minus a 0.5% productivity adjustment. FY 2026 dropped to 3.2% (about $1.16 billion), with an estimated $208 million shaved off by the SNF Value-Based Purchasing program. The proposed FY 2027 update sits at 2.4%: a 3.2% market basket increase less a 0.8% productivity cut. Each headline number sounds like real growth. Subtract the parity adjustments and the VBP withholding, though, and the net always lands smaller than the press release suggests. An operator budgeting off the gross CMS percentage is going to miss, and miss in the same direction every time.
What a study of two million Medicare patients revealed about coding behavior after PDPM
The most rigorous look at what happened came out in September 2025, when JAMA Internal Medicine published an analysis of 2,065,809 Medicare beneficiaries (mean age 81.2, 61% female, 86.8% White). It's the largest peer-reviewed dataset on PDPM's financial effects to date, and the numbers are hard to wave off.
PDPM implementation tracked with a 0.54-point increase in relative coding intensity, statistically significant, alongside a $665 increase in SNF episode spending per patient. Here's the detail that ought to sit uneasily with anyone running a facility or writing regulation: 30-day rehospitalization and mortality didn't move at all. Spending went up. Coding went up. The two hardest outcome measures available stayed exactly where they started.
Where did the intensity increase concentrate? Patients with higher clinical complexity, which makes sense on its face, but also for-profit SNFs specifically, and that's a distinction regulators aren't likely to lose interest in soon. The comorbidities showing the sharpest jumps in documented frequency were weight loss, complicated hypertension, obesity, and chronic pulmonary disease, with the steepest coding rise among patients hospitalized for congestive heart failure. The shift wasn't purely reactive, either: the average comorbidity index across nursing homes climbed from 9.9 to 10.3 between January 2018 and February 2020, with the sharpest climb landing in the 100 days right before October 1, 2019. Facilities were adjusting documentation before the rule even took effect.
What should a reader make of that? Coding intensity can reflect legitimate capture of complexity that was always there but never got written down under RUG-IV, back when therapy minutes were the currency and comorbidity coding didn't move the needle at all. It can also reflect upcoding. It's probably some mix of both, in proportions nobody has cleanly separated yet, and that's the uncomfortable part for anyone looking for a tidy answer. The JAMA authors themselves call for "continued monitoring to ensure PDPM incentives support accurate coding, equitable reimbursement, and high-quality care," language that's measured but points pretty clearly at where the next round of scrutiny is headed. Sorting legitimate capture from overreach is exactly what audits exist to do, and the section on compliance risk further down picks that thread back up.
How PDPM's revenue logic plays out differently across facility types and payer mix
The aggregate FFS Medicare margin for freestanding SNFs in 2023 was 21.9%. On its own, that sounds like a sector doing quite well under PDPM. Set it next to the all-payer total margin for the same year, just 0.4% (up from -1.3% in 2022), and the story changes completely.
MedPAC has flagged for years that margins vary enormously across facilities, shaped by cost per day, economies of scale, and how fast costs grow relative to revenue. The for-profit and nonprofit split is stark: pre-PDPM MedPAC data showed for-profits averaging a 13.7% Medicare margin against just 1.7% for nonprofits. Given that the 2025 JAMA study found coding intensity increases concentrated in for-profit facilities, that gap has probably widened rather than narrowed since PDPM took hold. For-profits aren't a small slice of the sector, either. They run 73% of facilities, cover 75% of FFS stays, and pull in 79% of revenues as of 2023.
So why does the FFS Medicare margin mislead as a benchmark? Because Medicaid, not Medicare, is the dominant payer by volume, covering most patient days in most facilities. Medicare FFS covers a much smaller slice of days but a disproportionate share of revenue, since its rates run so much higher. Add in the growth of Medicare Advantage, which keeps eating into that high-margin FFS census, and you get a structural squeeze: facilities lose ground on their best-paying population while their largest population, Medicaid, pays the least. PDPM's revenue upside doesn't spread evenly. It flows mainly to facilities that can both attract complex Medicare patients and code them right. A facility heavy on Medicaid census doesn't get much out of PDPM's cleverest features, no matter how sharp its documentation gets.
How cost structure shifted as PDPM changed what SNFs spend money on
Margins compressed in 2023 for a simple arithmetic reason: costs per day rose 3.8% while payment per day rose only 2.4%. When costs outrun revenue growth by that much, the margin erosion isn't a mystery. It's subtraction.
Ancillary costs tell their own story. From 2019 through 2022, ancillary costs per day actually fell year over year, which tracks with what you'd expect once PDPM pulled out the incentive to pile on therapy minutes. Then in 2023, ancillary costs per day rose 4%, the first annual increase since PDPM began, driven by PT, OT, and drug costs. That reversal is worth sitting with: if therapy delivery is climbing again at the same time coding intensity is climbing, the original efficiency argument behind PDPM, that it would right-size therapy to clinical need instead of reimbursement incentive, looks shakier than it did in year one.
Workforce costs, meanwhile, have cooled some. Hourly wages in the SNF sector grew 3.3% in 2023, the smallest increase since 2018, and preliminary first-half 2024 data showed that growth slowing further to 1.7%, a bit of breathing room after the wage spikes of the pandemic years. It won't go uncontested, though: a pending federal staffing mandate is going to add cost pressure that plenty of facilities, especially nonprofit and Medicaid-heavy ones, may not have the margin to absorb without real strain.
PDPM opened a real revenue opportunity for facilities that document complex cases well. But rising ancillary costs, wage pressure, and payer-mix erosion mean capturing that revenue is necessary, not enough on its own, for staying financially stable.
Where audit and compliance risk concentrates under PDPM
The JAMA study's central finding, more coding intensity with no matching improvement in outcomes, is precisely the pattern CMS and the Office of Inspector General look for when deciding where to point a targeted review. That pattern doesn't prove wrongdoing by itself, but it does invite the question, and that question is now being asked at scale.
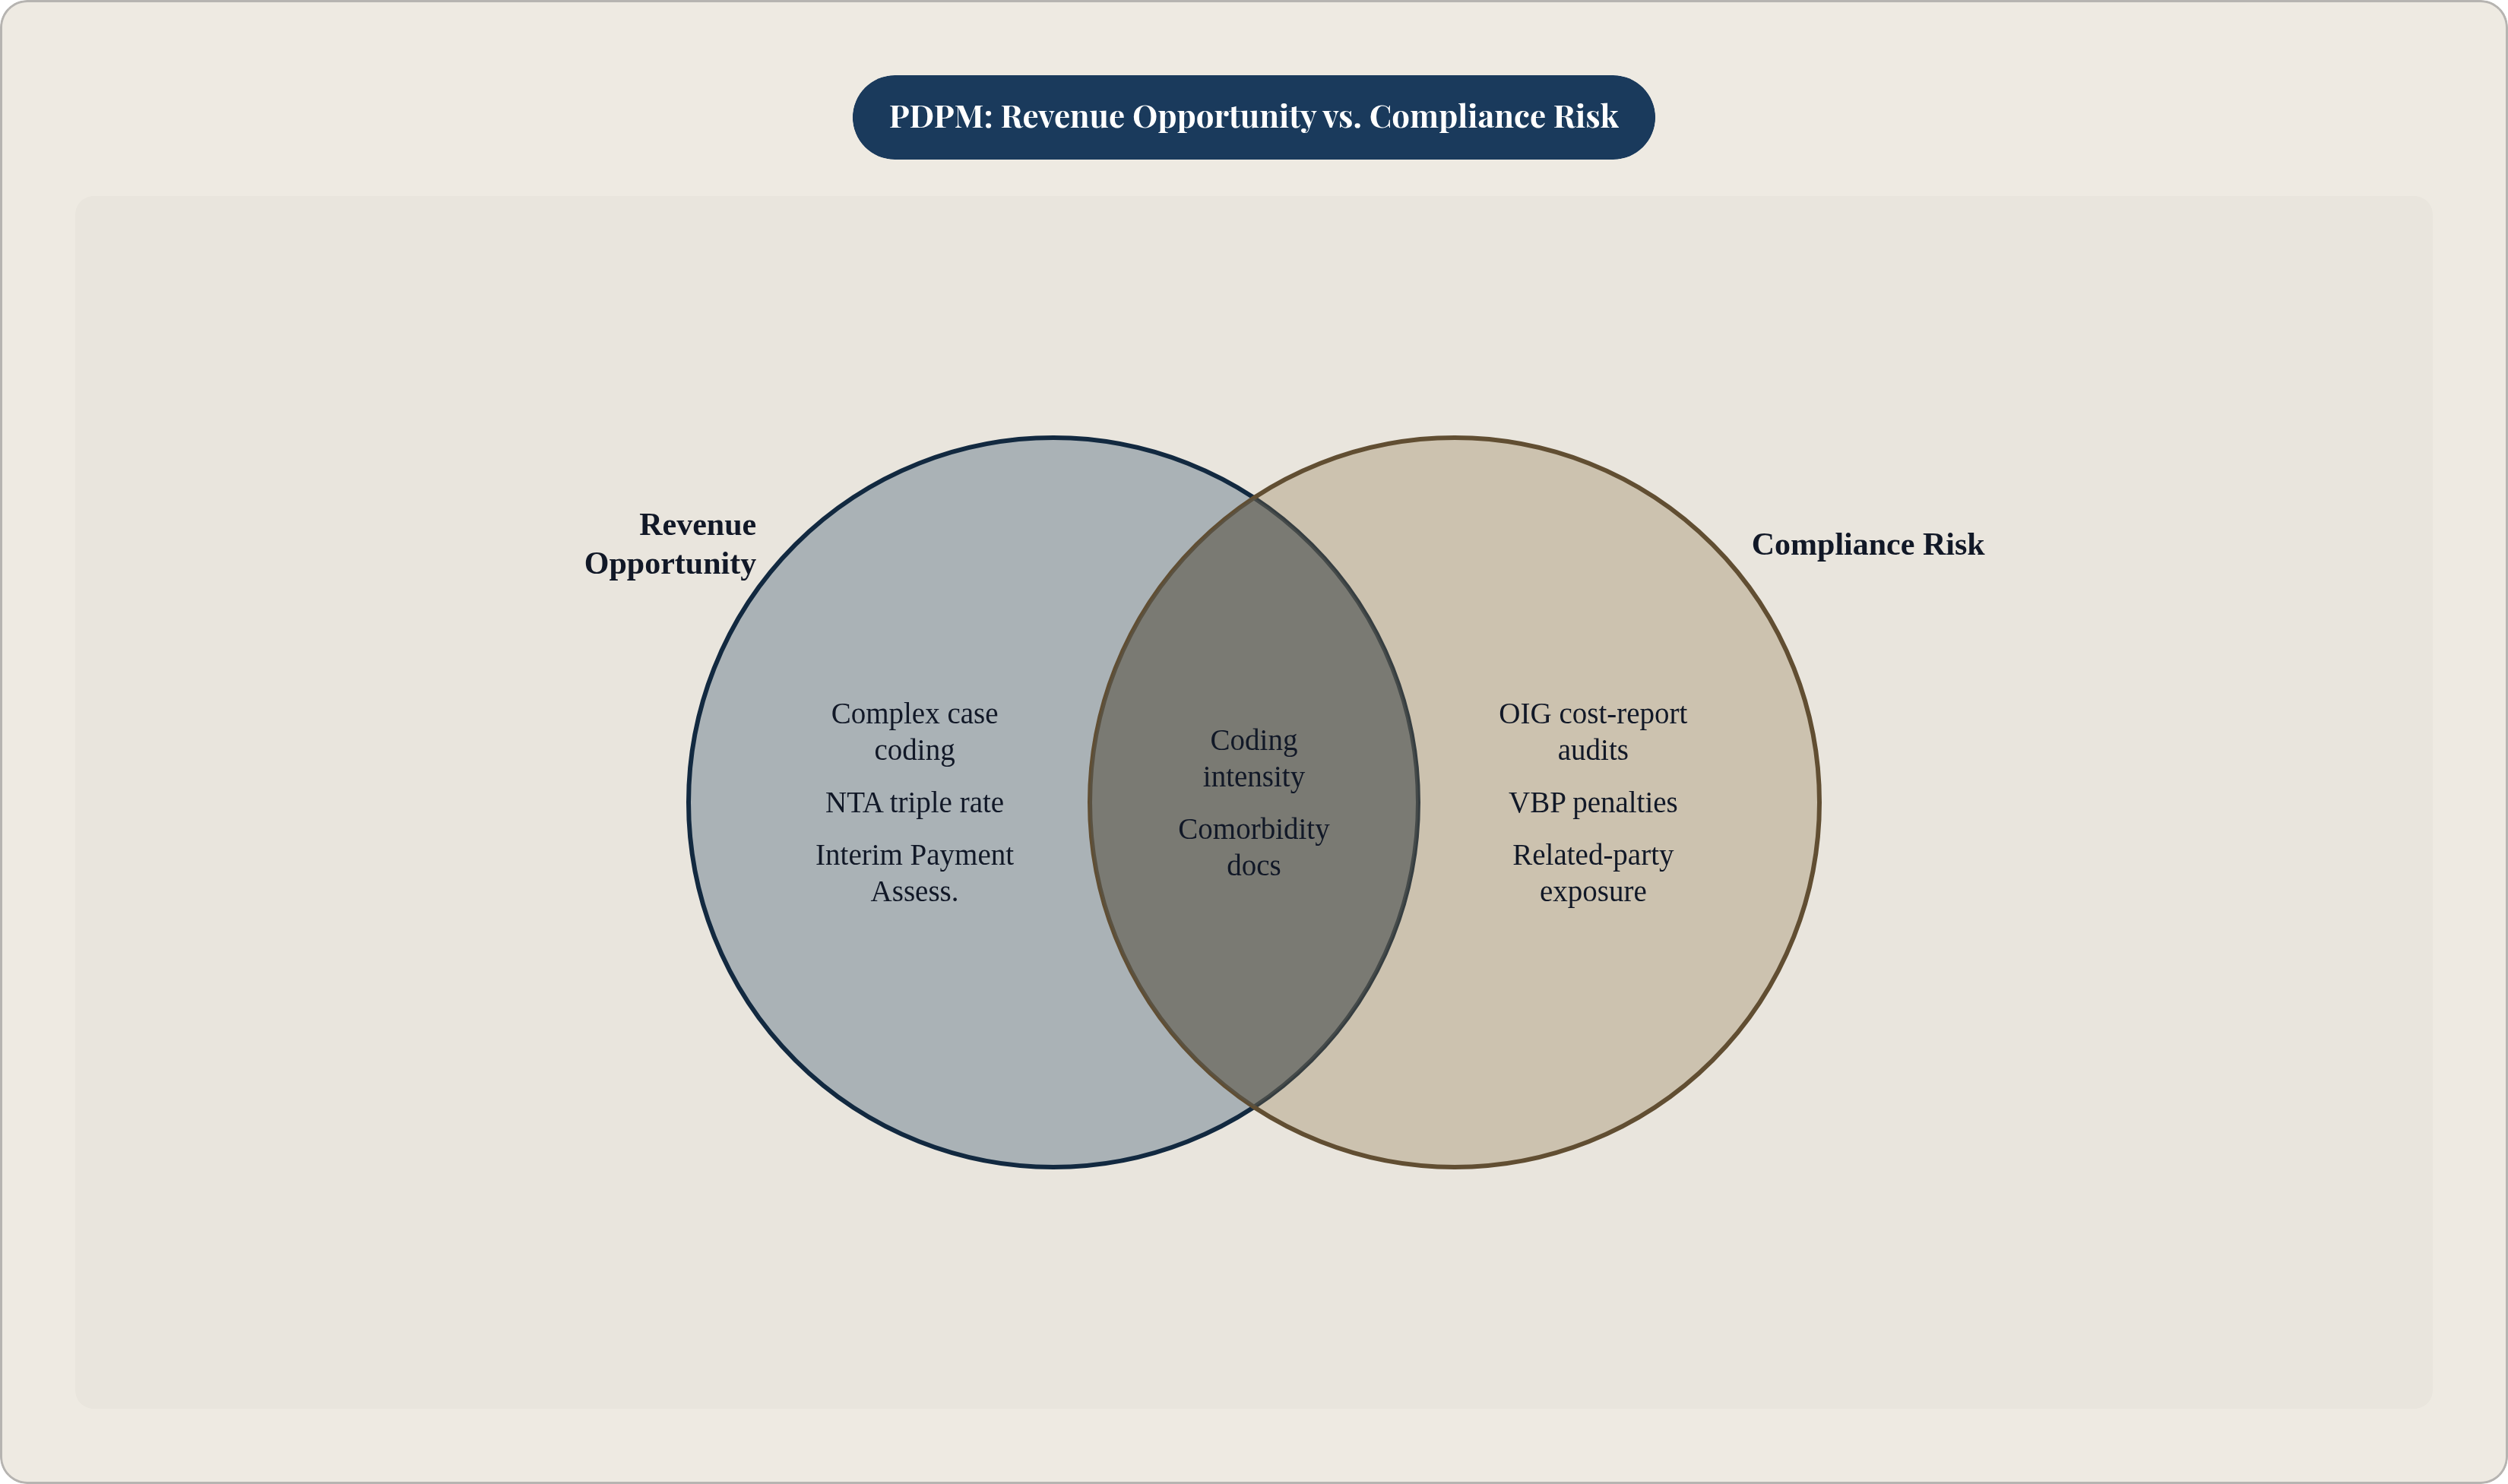
The Non-Therapy Ancillary component sits at the center of this. Its triple reimbursement rate for the first three days of a stay creates a strong financial pull tied directly to how many comorbidities get documented, which is exactly why CMS audits focus so heavily on whether the comorbidities coded on the MDS actually hold up against the clinical record. The conditions the JAMA study flagged as rising fastest, weight loss, complicated hypertension, obesity, chronic pulmonary disease, are also the conditions most likely to draw a second look from an auditor. That overlap isn't coincidence. It's the whole logic of risk-based review.
IPAs carry their own exposure. Filing an Interim Payment Assessment to capture a higher rate after a "significant change in condition" requires documentation showing the change was clinically real, not administratively timed to reset the case-mix score. A facility acting in good faith mostly has nothing to fear here, but the paperwork needed to prove good faith after the fact is heavier than most facilities plan for going in.
Related-party cost reporting is a separate risk area, and the OIG numbers are worth sitting with. Across cost reporting periods spanning FYs 2015 through 2020, SNFs reported $160.4 billion in Medicare payments and $65.4 billion in related-party payments over that window. In a nonstatistical sample of 14 SNFs, OIG found 3 that failed to properly disclose related parties, and 7 of the 14 had improperly adjusted related-party costs, together overstating costs by more than $1.7 million. Maybe the most telling detail: Medicare administrative contractors weren't reviewing related-party disclosures as part of routine oversight at all. The exposure just sat there, mostly invisible, until OIG went looking on purpose.
Value-Based Purchasing penalties add another layer that's easy to underweight when planning a budget. CMS withheld $184.85 million from SNFs in FY 2024, with an estimated $208 million withheld in FY 2026. Facilities with weak quality metrics absorb these cuts directly, stacked right on top of the parity-adjustment compression already eating into rate updates. The parity adjustment, the JAMA publication, and the OIG cost-report findings all point the same direction: coding scrutiny and compliance expectations are tightening, not easing off.
What disciplined financial oversight looks like for a SNF operating under PDPM
So what does a facility actually do with all this? Start from the idea that clinical coding accuracy is a financial control now, not just a task handled by the MDS coordinator down the hall. MDS coding has to reflect what's genuinely documented in the clinical record, not whatever maximizes NTA points on paper. Internal coding audits and interdisciplinary reviews, where nursing, therapy, and coding staff sit down together and compare notes, cut down both OIG exposure and the risk of a MAC clawing back payment after the fact. Checking coding before a claim goes out costs far less, in money and in stress, than fixing it after an audit letter shows up.
Financial statement audits for SNFs have gotten genuinely harder under PDPM. An auditor now has to understand how the five case-mix components map onto the MDS assessment cycle just to make sense of revenue recognition, and payer-mix reporting, Medicare FFS, Medicare Advantage, Medicaid, private pay, has to be broken out with precision. California's SB 650, effective for fiscal years ending December 31, 2023, made this explicit, requiring CPA-reviewed statements of patient census and patient revenue, backed by civil penalties of $100 a day for late filing, up to $36,500. Facilities outside California shouldn't read that as someone else's problem. It reads more like a preview of where reporting standards are heading nationally.
Related-party transactions need proactive disclosure and cost-limitation analysis on every cost report, not just when someone happens to remember. The OIG findings make it plain that routine MAC review isn't a reliable backstop here; three of fourteen sampled facilities missed disclosure entirely, and that's not a margin for error anyone should accept when the alternative is a targeted audit.
Rate modeling deserves the same rigor. A 3.2% FY 2026 increase or a proposed 2.4% for FY 2027 means very little on its own. It has to get netted against parity adjustments, VBP withholding, and the facility's actual cost-per-day trend before it turns into a usable budget number. Facilities that plan around the gross CMS figure instead of the net one are the ones explaining a shortfall mid-year, usually to a board that thought the number on the press release was the number that mattered.
Pease Bell built its skilled nursing practice around this kind of work: financial statement audits, Medicare cost report review, and regulatory compliance advisory shaped around how PDPM actually functions day to day, not how it reads in a CMS press release. It's detail-heavy work, the kind that takes partner-level attention precisely because the stakes cut both ways, the upside and the audit exposure sitting right next to each other on the same balance sheet. PDPM gave SNFs a real way to earn more by documenting clinical complexity accurately. That same incentive is exactly what CMS, OIG, and now peer-reviewed researchers are watching most closely. Financial oversight under PDPM stopped being a back-office task somewhere along the way. At this point, it's a strategic one.